


Call Us
+86-19518020980
Email Us
chloe@kebonfirstaid.com

U.S. Consumption Downgrade Deepens: Consumers Desert Mid-Tier Retailers as Inflation Hits a 3-Year High Trade-down wave sweeps across income brackets, with discount retailers and value platforms emerging as biggest winners
U.S. Consumption Downgrade Deepens: Consumers Desert Mid-Tier Retailers as Inflation Hits a 3-Year High
Trade-down wave sweeps across income brackets, with discount retailers and value platforms emerging as biggest winners
NEW YORK — American consumers are undergoing one of the most profound shifts in spending behavior in over a decade. As persistent inflation continues to erode purchasing power and household debt reaches historic levels, a wave of consumption downgrade—or “trade-down”—is sweeping across the United States, fundamentally rewiring the nation’s retail landscape.
The numbers tell a stark story. In April 2026, the headline Personal Consumption Expenditures (PCE) price index rose 0.4 percent month-over-month, pushing annual inflation to 3.77 percent—well above the Federal Reserve’s 2 percent target. Core PCE, which strips out volatile food and energy prices, stood at 3.29 percent year-over-year. The U.S. Consumer Price Index (CPI) climbed to 3.8 percent in April, marking its fastest annual increase in three years, driven largely by surging energy costs that sent gasoline prices above US$4 per gallon nationwide.
Yet inflation alone does not capture the full picture. More telling is what Americans are doing with their money—or rather, how they are being forced to spend it.
🧾 Household Debt at All-Time High, Delinquencies SurgeBehind the trade-down trend lies a household balance sheet under severe strain. According to data released by the Federal Reserve Bank of New York in May 2026, total U.S. household debt has reached an all-time high of US18.8trillion—aUS18.8trillion—aUS591 billion increase from the first quarter of 2025. Within this total, credit card balances have climbed to a record US1.28trillion[reference:4],whileautoloandebthasballoonedtoUS1.28trillion[reference:4],whileautoloandebthasballoonedtoUS1.68 trillion, up nearly 40 percent from 2018.
The delinquency picture is equally alarming. Credit card delinquency rates have surged to 13.1 percent, the highest level in approximately 16 years and approaching levels last seen during the 2008 financial crisis. Auto loan delinquencies have also reached record highs in the first quarter of 2026, while student loan delinquency rates have risen to 10.3 percent following the expiration of pandemic-era repayment protections. Compounding the distress, delinquent borrowers are increasingly falling behind on multiple types of debt simultaneously—a clear indicator of deepening financial strain across American households.
The pressure is most acute for lower-income families, but it is by no means confined to them. Goldman Sachs now expects disposable cash flow for the bottom income quintile to grow just 0.8 percent in 2026, a sharp downgrade from its January forecast of 3.2 percent. Meanwhile, the personal saving rate plunged to 2.6 percent in April—the lowest level since June 2022—as households dip into reserves to cover everyday expenses.📉 Real Spending Power Deteriorates as “Income-Weak” Pattern EmergesThe macroeconomic data confirms what millions of American families already feel in their wallets. Real GDP growth in the fourth quarter of 2025 was revised down to a sluggish 0.7 percent annualized pace, far below the initial 1.4 percent estimate and a sharp deceleration from 4.4 percent in the third quarter. Full-year 2025 GDP growth was also revised downward to 2.1 percent.
More concerning is the emerging “income-strong, consumption-weak” pattern observed in early 2026. While personal disposable income rose 0.9 percent month-over-month in January, real PCE grew by only 0.1 percent, with goods consumption actually declining and the household saving rate climbing to 4.5 percent—evidence that consumers are choosing to save rather than spend. In April 2026, real disposable personal income per capita decreased by 0.50 percent, meaning after-tax income rose less quickly than prices.
Retail sales data further underscores the fragility. December 2025 retail sales unexpectedly contracted by 0.2 percent from November, with nominal retail sales rising just 2.4 percent year-over-year—a figure actually lower than the 2.7 percent CPI inflation rate for the same period, indicating real consumption contraction. While headline April retail sales showed a 0.5 percent month-over-month increase, analysts caution that this was largely driven by a 5.4 percent surge in gasoline prices rather than genuine demand strength.🛍️ The Trade-Down Revolution: From Mid-Tier to DiscountPerhaps the most visible manifestation of consumption downgrade is the dramatic shift in where Americans choose to shop. Rising inflation is prompting U.S. consumers to abandon mid-tier retailers in favor of discount shopping apps and off-price chains, marking a significant contraction in discretionary spending.
The data on discount retail performance is striking. Dollar Tree’s comparable sales rose 3.5 percent year-over-year in its fiscal first quarter, ahead of expectations, while Burlington Stores posted a 6 percent jump, beating estimates for 4.6 percent growth. Both retailers are gaining share across all income cohorts, with Burlington noting that stores in lower-income areas outperformed the rest of its fleet and Dollar Tree reporting positive comparable sales growth across every income bracket.
The off-price sector’s success is coming directly at the expense of traditional full-price operators. Burlington CEO Michael O’Sullivan noted that the off-price channel is winning share from conventional retailers—a dynamic he expects will accelerate further if economic conditions worsen. Meanwhile, mid-tier retailers like Target are facing sustained pressure as the “retail middle ground” continues to erode.
The digital side of the trade-down trend is equally dramatic. Discount shopping app Temu saw its U.S. monthly active users surpass 100 million, according to third-party data from Similarweb. In April alone, Temu’s U.S. downloads surged 235 percent in the final week of the month, while discount apparel app Shein saw downloads spike 134 percent. The explosive growth coincided with average gasoline prices exceeding US4pergallonnationwide,drivingconsumerstoconsciouslytradedowntheirpurchases.AsoneAIcommerceexecutivetold∗Barron’s∗,“It’sconsumerssaying,‘Istillwantanicespringoutfit,butmybudgetjustwentfrom4pergallonnationwide,drivingconsumerstoconsciouslytradedowntheirpurchases.AsoneAIcommerceexecutivetold∗Barron’s∗,“It’sconsumerssaying,‘Istillwantanicespringoutfit,butmybudgetjustwentfrom30 to $10. Where can I find that now?’”
The shift toward value extends beyond discount chains. Amazon CEO Andy Jassy recently confirmed that Amazon shoppers are increasingly switching to cheaper brands as tariffs raise prices across product categories. Even higher-income households are joining the trend: the share of high-income consumers shopping at discount retailers rose from 19.8 percent in 2021 to 27.5 percent in 2025. The Conference Board similarly noted that consumer spending trends in 2026 remain focused on “cheap thrills” and necessary services.📊 Smaller Baskets, Fewer Non-EssentialsIt is not just where consumers shop—it is what they buy. The trade-down phenomenon is reshaping purchase baskets across virtually every retail category.
Average Order Value (AOV), a critical measure of spending intensity, fell sharply across multiple sectors during the 2025 holiday season—a period when order values would typically be expected to rise. AOV sank 28 percent in computers and electronics, fell 10.9 percent in health and beauty, and softened 5.2 percent in retail and shopping overall. The declines suggest that even when consumers continued spending, they did so far more cautiously, with smaller baskets, heavier reliance on discounts, and a pronounced shift toward practical, high-value purchases.
The Alvarez & Marsal Spring 2026 Consumer Sentiment Survey, based on a nationally representative sample of over 2,100 adults, found that consumers plan to spend less in every category except groceries—where spending expectations are lifted by inflation rather than genuine desire to purchase more. This points to a broad-based and sustained pullback in both discretionary and non-discretionary spending alike. As Chad Lusk, Managing Director at A&M’s Consumer and Retail Group, noted: “Today’s consumers aren’t simply tightening their belts—they’re making thoughtful trade-offs. They’re cutting back on volume and dramatically changing shopping routines to stretch their wallets.”
The survey also revealed that 27 percent of consumers plan to keep their preferred brands but switch to a less expensive store to buy them—up significantly from 16 percent in Fall 2025. Private label products continue to shed their trade-down reputation, with 68 percent of consumers rating store brand quality as equal to or better than national brands.
Non-essential categories are bearing the brunt of the pullback. Bloomberg analysis indicates that rising inflation and surging gas prices are relentlessly eroding disposable income, forcing households to slash spending on big-ticket discretionary items such as automobiles and furniture. Even tax refunds—typically a source of consumer spending boosts—are being deployed more cautiously. According to NRF data, the share of tax refunds allocated to debt repayment rose from 30 percent to 32 percent in 2026, while the share directed to savings increased from 42 percent to 52 percent. Spending on non-durable goods, large purchases, and luxury items has correspondingly declined.🔮 The K-Shaped Reality: Implications for BrandsThe cumulative evidence points to a “K-shaped” economic reality: higher-income households, buoyed by stock market gains and larger tax refunds, continue to spend relatively normally, while lower-income and middle-income consumers—already squeezed by inflation, rising debt service costs, and stagnant wage growth—are cutting back aggressively. The widening gap between these two trajectories suggests that the consumption downgrade is not a temporary correction but a structural shift in how Americans spend.
For retailers and brands, the implications are clear. Value is rapidly becoming the primary purchase consideration across all income levels. Dollar Tree and Burlington expect to continue gaining share as economic uncertainty persists. The Conference Board noted that retailers are increasingly adjusting their inventory, pricing, and promotional strategies to match more selective, value-driven shopping patterns. Yet even with these adjustments, analysts caution that the outlook remains fragile. The Expectations Index of the Consumer Confidence Index remains below 80—a level economists often associate with increased recession risk if sustained.
As one industry observer summarized: “For other retailers [beyond discount chains], the challenge will be to attract price-sensitive consumers without eroding margins.” In an environment where consumers are prioritizing necessities, hunting for bargains, and scrutinizing every dollar, the retailers and brands that will thrive are those that offer genuine value—not just lower prices, but smarter products, transparent pricing, and demonstrable utility.
The consumption downgrade is not merely a headline. It is the new reality of the American economy in 2026.
About This Release:
This news release is based on data from the U.S. Bureau of Economic Analysis, the Federal Reserve Bank of New York, The Conference Board, Alvarez & Marsal’s Consumer and Retail Group, the National Retail Federation, emarketer, Bloomberg, and additional sources cited herein. Figures are current as of May 2026.
Media Contact:
kebon healthcare
www.kebonhealthcare.com
chloe@kebonhealthcare.com
Keywords: US consumption downgrade, trade-down, discount retail, inflation, consumer spending, household debt, Temu, Shein, Dollar Tree, Burlington, retail trends, K-shaped economy, US economy 2026
Send Inquiry




X
We use cookies to offer you a better browsing experience, analyze site traffic and personalize content. By using this site, you agree to our use of cookies.
Privacy Policy
News
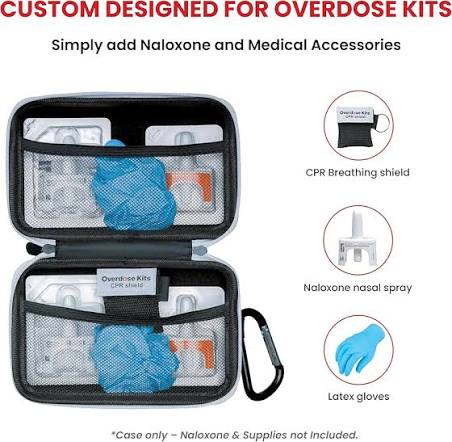 NY Workplace Naloxone Rule: What Changes on 13 December 20262026/10/19
New York's workplace naloxone requirement takes effect 13 December 2026. What the proposed rules require, who is covered, and what to do now.
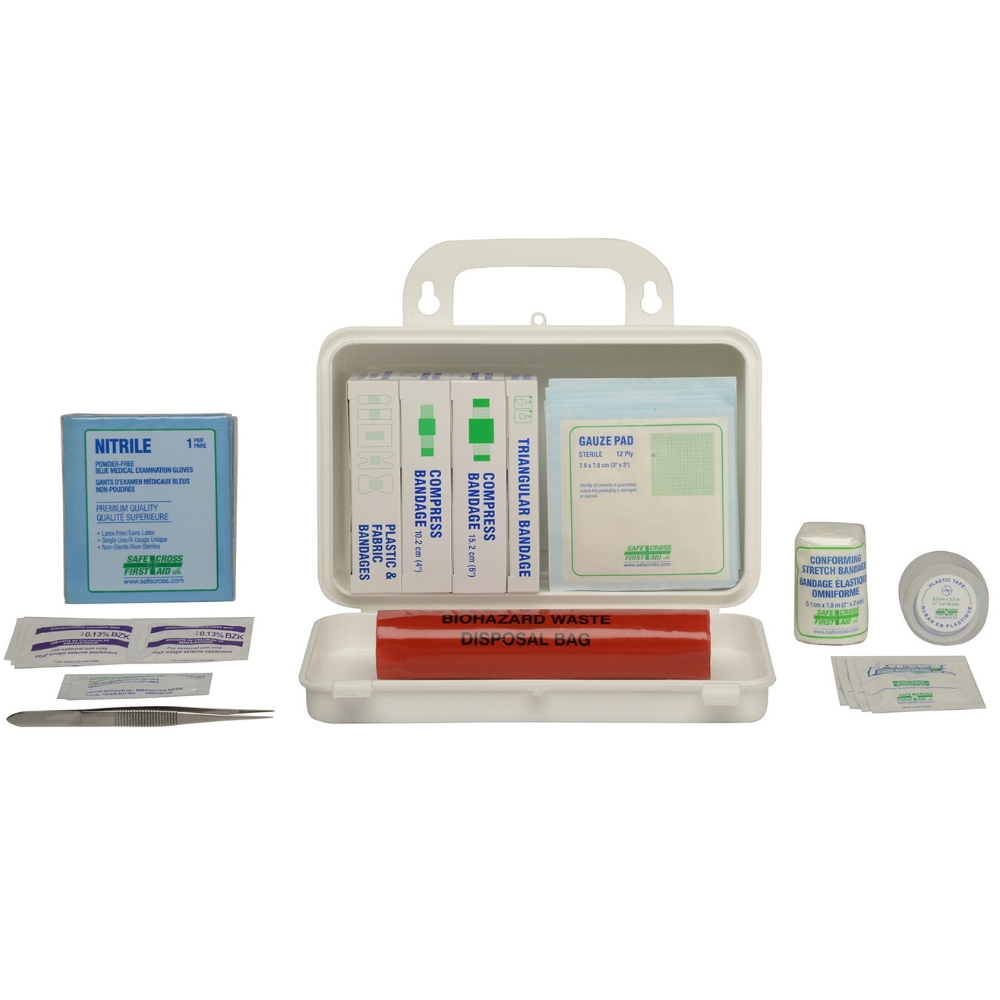 Canada Federal First Aid Kit Rules: CSA Z1220 Proposal2026/10/19
anada proposes replacing federal first aid kit content lists with CSA Z1220 across five OHS regulations, covering 20,738 workplaces. Comment deadline: 2 November 2026.